
Guides · Plan and forecast
Sales plan vs demand forecast: why do they differ, and how can you manage the gap?
At a meeting about the coming months, two reports appear. The sales plan shows one figure; the demand forecast shows another. People start checking files, refresh dates and formulas. Which number is right? Both reports may be correct. They may also contain errors that cancel each other out and disappear in the total. Before deciding what to change, establish whether you are seeing a genuine business difference or comparing inconsistent data.
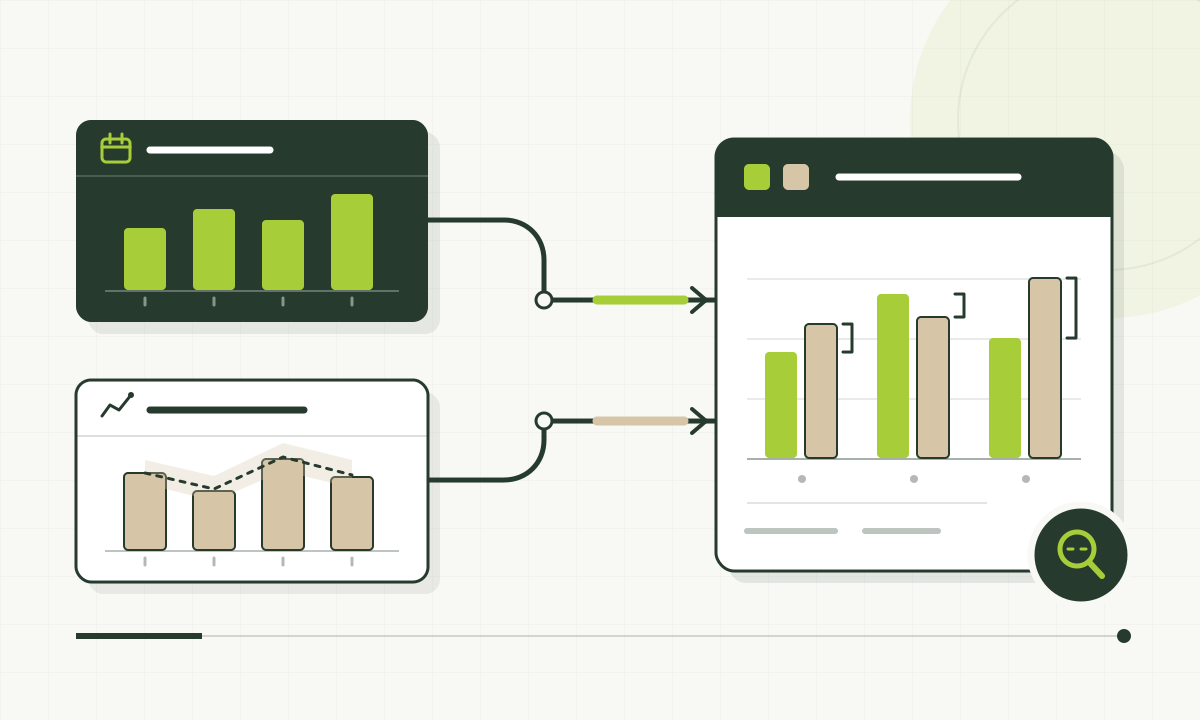
The plan and forecast may answer different questions
A sales plan may represent an approved target, a budget or the latest estimate of sales. A demand forecast may describe expected market demand, regardless of whether the company can fulfil it in full. These are different perspectives.
A sales target may assume that new customers will be won. The forecast may not yet include those orders because their probability is too low. Conversely, expected demand may exceed achievable sales because product availability is limited.
Reconciliation should therefore begin with a question: what exactly does each figure mean?
In integrated planning, reconciling the views of sales, finance and planning is a distinct collaborative stage, followed by a decision on the assumptions to adopt. It is not simply a technical table join. SAP's planning process also separates reconciliation from the subsequent management decision.
The aim is not to force identical values. It is to arrive at a difference that people understand and can explain.
First, agree on a common basis for comparison
Even correct files can produce misleading results if their scope differs. Agree on the following elements before calculating variances.
A difference in sales value does not necessarily mean a difference in volume. Prices or the product mix may explain it. Subtracting one total from another will not establish the cause.
A practical starting point is a short, shared definition of the comparison: scope, source versions, units and the variance calculation. This prevents the meaning of the numbers from changing with the next report refresh.
- Period: do both reports cover the same months? Are you comparing the full year or only its remaining months?
- Version and scenario: are you comparing the approved plan with the latest forecast, or accidentally mixing planning cycles or a base case with an optimistic scenario?
- Event date: does a month refer to an order, delivery, invoice or another event?
- Product and market: do product codes, pack sizes, countries and sales channels correspond?
- Unit: are the figures individual items, packs, cases or converted units?
- Valuation: when comparing monetary amounts, are prices, discounts, currencies and exchange rates consistent? Are both amounts net or both gross, using the same definition?
Matching totals can conceal a problem
Consider this illustrative example, which does not represent any client's data. We compare one month, one market and the same unit of measure: individual product units. The gap is defined as the sales plan minus the demand forecast.
For products A and B, the sales plan totals 200 units and the forecast also totals 200. The summary appears reconciled. Yet the plan exceeds the forecast for A by 20 units, while the reverse is true for B. These differences may require separate decisions about sales activity, inventory or planning assumptions.
Product C remains unresolved. The full sales plan is 260 units, but there is no complete forecast for the portfolio. The equation 200 = 200 applies only to the comparable products A and B, not to the entire plan. C is excluded from both comparable-scope totals and explicitly shown as missing a forecast.
Do not present the difference of 60 as a confirmed demand gap. The missing data must be investigated first. The report should show the result for comparable items separately from the scope that could not be compared.
| Product | Sales plan, units | Demand forecast, units | Gap: plan − forecast, units |
|---|---|---|---|
| A | 120 | 100 | +20 |
| B | 80 | 100 | −20 |
| C | 60 | Missing data | Not calculated |
Missing data is not zero
An empty entry may mean that the forecast has not been prepared, the product has not been matched or an incomplete export has been loaded. It may also mean that the item should be outside the comparison. None of these situations automatically means zero demand.
For C, a confirmed forecast of zero allows a gap of +60 to be calculated. A missing forecast should instead be flagged for investigation, with no calculated gap. Replacing every blank with zero creates an apparently complete report but removes evidence of the problem.
There is a similar trap when joining tables. Keeping only items present in both sources can make unmatched products disappear from the analysis entirely. The join type must fit the control's purpose. Power Query supports retaining all items as well as identifying unmatched items separately.
Replace another spreadsheet with a list of decisions to make
A variance report should help people act, rather than stop at a red cell. Every material difference needs context, clear responsibility and a next step.
Distinguish two types of issue. Data problems include a missing file, inconsistent units, an outdated product mapping or rows multiplying after a table join. Business differences may arise from a new promotion, an order moving to another period, changed sales assumptions or availability constraints.
The first group requires corrections to data or processing rules. The second requires a decision agreed by the responsible teams. Automatically overwriting the forecast with the plan obscures this distinction.
- Product, market and period.
- Compared values and their source versions.
- Data completeness status.
- The reason for the difference, or a clear indication that it remains unknown.
- The person responsible for investigating it.
- Proposed action, due date and approval status.
Set priorities without relying on percentages alone
Priorities can use agreed thresholds based on quantity, value or percentage. A percentage alone is not enough: a large relative variance on a small item may matter less than a small percentage difference on a critical product.
A zero denominator needs separate treatment. Do not replace a division-by-zero error with a result that implies no variance. Show the absolute difference and explain the situation. Missing data should remain a separate category rather than being included among reconciled items.
What should be automated, and what still needs approval?
Capture recurring steps in one repeatable process. This reduces manual transfers between files, but it does not remove the need to check the comparison rules.
Tools can identify empty values, errors and data distributions. In Power Query, remember that profiling covers the first 1,000 rows by default. Profiling the full dataset requires changing that setting.
- Load the correct files or data from approved sources.
- Standardise structure, codes, dates and units.
- Check data completeness and whether records are unambiguous.
- Join the reports while retaining unmatched items.
- Calculate differences for the comparable scope.
- Prepare an exception list for review.
Separate a proposed change from an approved adjustment
Automation should not decide on its own whether to raise or lower the forecast, or align it with the sales target. That is a business decision requiring a rationale and an identified approver.
Retain the input versions and distinguish a proposed change from an approved adjustment. This makes it possible to reconstruct what changed, why and on the basis of which decision. The record should also identify the approval time and the version concerned.
Approval means adopting a particular version and its assumptions for subsequent work. It does not make a forecast certain or justify removing the original version from the history.
Check the report's substance, not just its refresh date
Before the reconciliation meeting, check whether the report actually answers questions about comparability, completeness and accountability. The checklist below provides a starting point.
A successful file refresh does not answer those questions. It only confirms that the process executed its configured steps. It does not confirm that the inputs were complete or that the business assumptions were appropriate.
A good forecast does not have to confirm the plan
A forecast that signals a risk of missing the target is not necessarily wrong. It may provide precisely the information needed to respond early enough.
Assess its accuracy later against actual results, taking the specific forecast version and horizon into account, rather than judging it solely by agreement with the plan.
Start by clarifying definitions, completeness checks and responsibility for exceptions, rather than building another dashboard. Reliable reconciliation does not mean that every number becomes the same. It means knowing why the figures differ and what to do about it.
Checklist before approving the report
- Have we deliberately selected the versions and scenarios, with matching periods and units?
- Do we know the full scope of missing and unmatched items, without replacing missing values with zeros?
- Have table joins avoided multiplying the figures?
- Does the summary reveal, rather than hide, offsetting product-level variances?
- Does every material difference have an owner, explanation, due date and decision?
- Are net or gross definitions, prices, discounts, currencies and exchange rates consistent?
- Have we retained input versions, adjustment rationales and approval history?
- Do exception thresholds reflect business impact and handle zero denominators explicitly?
Keep the checklist by printing this guide to PDF from your browser.
Downloads
Sales plan–demand forecast difference register
Fields for a discrepancy, its cause, owner and decision. Editable TXT file.
Questions and answers
Should the sales plan and demand forecast be identical?
Not always. The plan may be a target, while the forecast estimates expected demand. Establish definitions and a common scope first. Reconciliation should explain differences and support decisions, not automatically force one value to match the other.
Can a missing forecast be treated as zero demand?
Only when the data owner confirms that missing means zero under the agreed rules. Otherwise, the item needs investigation. It should have no calculated gap and should not disappear inside the comparable-scope total.
Will a new Power BI report resolve the differences?
It can help expose exceptions and monitor the process, but report design alone cannot agree on definitions or assign responsibility. Comparison rules, data quality checks, versioning and a process for making and approving decisions must come first.